Near-Shore Buoy
Data Collection System
Oct 2020-May 2021
With the Invent Team at Landmark High School we created a Buoy with an internal system that collected and transmitted environmental data from near-shore locations. We presented a proposal and was awarded a $10,000 grant from MIT/Lemelson to support our research. I acted as a lead presenter for multiple status meetings and the final project overview.


How Does it Work?
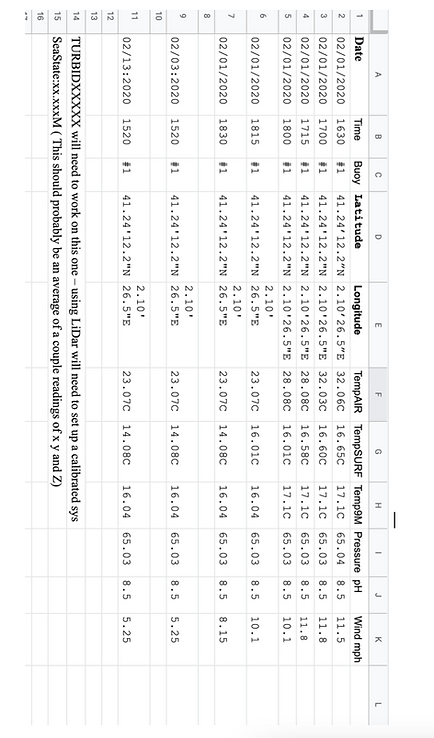
Buoys will be set in a pre-selected location up to 2 miles offshore. Pre-balanced before launch, the buoy will float with the top 1 meter above the surface. Once powered up, the GPS system will log the location - which will be used to identify the buoy during each data transmission. At the top of the hour, (or multiple times an hour) the system’s sensors are polled by the software and logged on a SIM card. Data is then transmitted via the Cell STMP network to the computer systems. Data is automatically transferred to a spreadsheet for sharing and evaluation. Batteries are trickle charged by an onboard solar array which extends the life of the buoy to between 6 to 12 months.

Iteration #1

Iteration #2


Objective:
-
Provide quantitative data for the changing state of nearshore ocean environment, climate variations from month to month for long-term study.
-
Data will enhance student understanding and efficacy of long-term data collection and an understanding of local environmental conditions.
-
Shared data can be utilized to forecast seasonal changes in conditions and help in building models to test predictions.
-
Increase discussion, interaction of various stakeholders.

Static Sensor Array
-
Measure surface wind speed
-
Measure pH of surface water
-
Measure Temperature of air, surface water and at depth
-
Measure Water Turbidity
-
Measure Barometric pressure